Market Insights

Expert analysis for forex, cryptocurrencies, gold, and market trends.

A person in a suit holding a cup of coffee sits at a wooden table with a laptop displaying a cryptocurrency price chart and news headline. Nearby are a notepad with a pen, a tablet, and two coins, suggesting a workspace focused on financial activities.
Trading Strategies

Explore comprehensive trading strategies to enhance your market performance and achieve your financial goals with confidence and precision in fluctuating conditions.
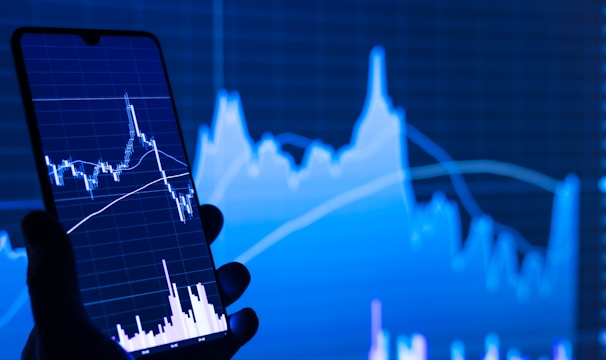
A hand holds a smartphone displaying a financial chart with candlestick patterns. In the background, a large, similar financial graph is visible on a screen, featuring fluctuating lines and data points.
Financial Trends

Stay updated on the latest financial trends and market dynamics that impact your trading decisions, enabling you to make informed choices and maximize your investment opportunities.

A smartphone displaying a financial chart with candlestick patterns is placed on a dark, crumpled fabric surface. The chart features various colored candlesticks against a dark background, suggesting financial analysis or stock market activity.

Insights

Explore data-driven analysis for forex, crypto, and global markets.

A digital financial chart with green and red zigzag lines on a dark background, representing market trends. Below the main graph, there are smaller charts featuring bar indicators in red and blue, along with a yellow line graph.
A tablet displaying a detailed digital financial trading interface with various graphs, charts, and numerical data. The screen shows candlestick charts with green and red indicators, illustrating market trends and stock prices.

Market Insights

Explore professional analysis for forex, cryptocurrencies, gold, and global markets. Gain clarity and confidence in your trading decisions with our insights.

Location

123 Market St, City

Hours

9 AM - 5 PM